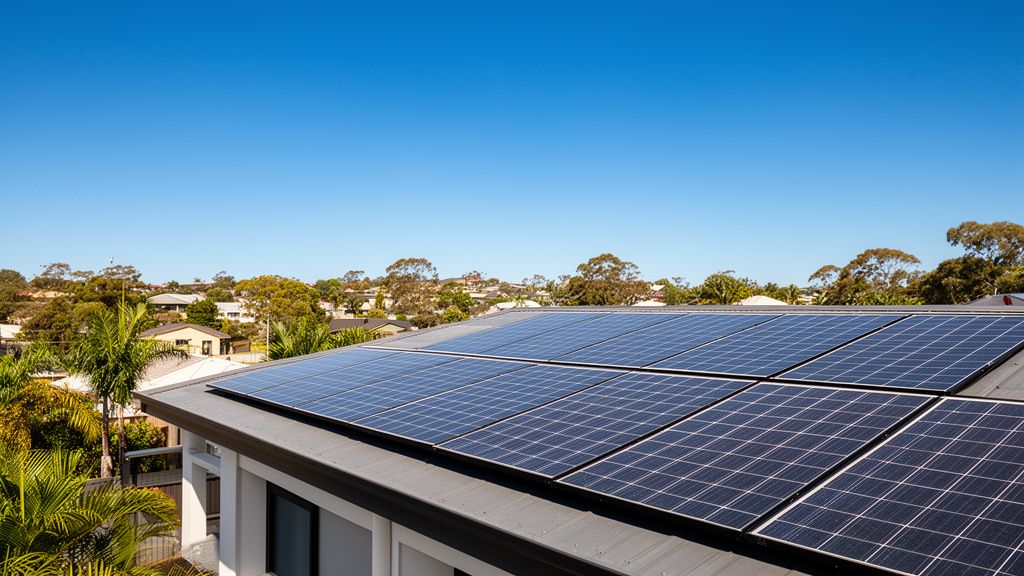
TL;DR: Compare your solar system's daily energy output from the same calendar date across different years. This method helps you spot significant performance drops that indicate potential faults or accelerated degradation beyond normal wear, allowing for early intervention.
Why Does Same-Date Comparison Work for Solar?
Comparing solar output from the same calendar date across years provides the most reliable baseline for identifying performance changes. Solar generation fluctuates wildly day-to-day due to variables like cloud cover, rainfall, and air temperature. A sunny winter's day in Brisbane produces vastly different energy to an overcast one. Trying to compare your system's output from January 15th to February 15th, or even January 15th to January 25th, introduces too many climatic differences to be useful for diagnosing subtle issues. The same date, however, often shares similar seasonal weather patterns, sun angles, and daylight hours, year after year. For example, comparing July 1st 2023's output to July 1st 2024's output provides a much fairer assessment of your system's health than comparing July 1st to August 1st. This normalises many of the environmental factors, letting you see if your panels or inverter are actually underperforming.
Overcoming Weather Variables
Daily weather is highly variable, but monthly and seasonal patterns are more consistent year-on-year in most Australian regions. By isolating a specific calendar date, you minimise the impact of these daily fluctuations. This method helps 'normalise' the comparison. You won't get identical weather, but the type of weather (e.g., mid-winter sun intensity, typical summer heat) is more predictable on the same date than comparing different times of the year. This consistency allows you to focus on the equipment's performance rather than external conditions.
Detecting Gradual Degradation
Solar panels naturally degrade over time, losing efficiency at a rate of roughly 0.5-1% per year. A year-on-year comparison highlights this expected degradation. More importantly, it helps you identify accelerated degradation or sudden, unexplainable drops in output that could point to a specific fault. If your 6.6kW system in Perth generated 28 kWh on January 10th last year, and only 20 kWh on January 10th this year, that's a significant drop well beyond normal degradation, warranting further investigation.
How Do I Collect the Data for My Same-Date Solar Check?
Accessing historical daily generation data through your inverter's monitoring portal or app provides the figures needed for comparison. Most modern inverters, whether they're from brands like Sungrow, Fronius, SMA, or Solaredge, come with an online monitoring platform or a dedicated smartphone app. This software tracks your system's performance, including daily kilowatt-hour (kWh) generation. You'll typically log into your account, navigate to a performance summary, and then drill down to specific days or months. While smart meters record your household's overall energy consumption and exports, they don't usually provide granular data on what your solar system generated. The inverter's data is what you need for this specific health check.
Using Your Inverter Monitoring App
To start, open your inverter's monitoring app or log in to the web portal. Look for sections labelled "Daily Production," "Energy History," or "Performance." You'll usually find a calendar view or a list of daily totals. Select a specific date from a previous year – for instance, today's date last year, or a particularly sunny day you remember. Note down the total kWh generated for that day. Then, check the same date for the current year. Repeat this process for several dates across different seasons to build a good understanding of your system's baseline. Some apps make this comparison very easy, others require manual note-taking.
What Data Points Do I Need?
The primary data point you need is the total daily kWh generation. This figure represents the total amount of electricity your solar system produced during a 24-hour period. While some monitoring platforms might show peak power (kW) reached during the day, or minute-by-minute graphs, the daily kWh total is the most consistent and straightforward metric for year-on-year comparison. Write down the date and the corresponding daily kWh for key comparison points, perhaps the first day of each month, or random mid-month days to get a representative sample. Keeping a simple spreadsheet for these numbers makes the comparison easy to track over time.
What Do Performance Drops Mean and When Should I Act?
A consistent drop of 5% or more in daily generation compared to the same date in previous years indicates a potential issue requiring investigation. While normal panel degradation accounts for about 0.5-1% efficiency loss annually, anything significantly above this needs a closer look. For example, if your system generated 30 kWh on a specific day last year and only 26 kWh on the same day this year, that's a reduction of over 13%. That's a strong indicator something is wrong. Common issues range from simple obstructions like dirt or new tree growth to more serious hardware failures such as a faulty microinverter, power optimiser, a damaged panel, or even an inverter fault. Start with visible checks and if the problem persists or worsens, contacting an authorised solar electrician is the next step.


Interpreting the Numbers
Consider a 6.6kW system in Adelaide that produced 27 kWh on October 1st, 2022. On October 1st, 2023, it generated 26.5 kWh, which is a minor, expected drop. But on October 1st, 2024, it only produces 22 kWh. This represents a drop of over 17% from two years prior, and a significant 16% from last year's figure. This is well beyond the typical degradation rate and indicates a serious performance problem. Fluctuations of 1-3% are usually fine, reflecting minor weather differences. A drop of 5% or more, consistently, across several comparison dates signals a genuine concern.
Common Causes for Reduced Output
The first thing to check is any obvious blockage. Heavy dust build-up, bird droppings, or new shading from growing trees or nearby structures can all reduce output. Cleaning your panels can often resolve minor drops. If the issue isn't visible, consider an individual panel or microinverter fault; many monitoring apps will show output for individual panels, which can pinpoint a problem. If multiple panels or the entire system's output is down, it could be an inverter issue or a wiring problem. Always switch off your system at the main solar isolator and inverter before any visual inspection on the ground. For anything beyond cleaning, always engage a Clean Energy Council (CEC) accredited electrician.
Key Takeaways
- Compare your solar system's daily kWh output from the same calendar date across different years.
- Use your inverter's monitoring app or web portal to access historical daily generation data.
- A consistent drop of 5% or more in daily output (beyond 0.5-1% annual degradation) signals a potential fault.
- First, check for visible obstructions like dirt, bird droppings, or new shading and clean panels if necessary.
- If cleaning doesn't help or the drop is sudden and significant, contact a Clean Energy Council (CEC) accredited solar electrician for diagnosis and repair.
Read More
For a comprehensive overview, check out our master guide: Read the Full Guide Here.